New Google Ads Charts for Reporting - Google Ads News
News! Google Ads launched 𝐧𝐞𝐰 𝐂𝐡𝐚𝐫𝐭𝐬 𝐟𝐨𝐫 𝐑𝐞𝐩𝐨𝐫𝐭𝐢𝐧𝐠. Just after they released the first Tree Table View that I spotted last week. All you need to know:
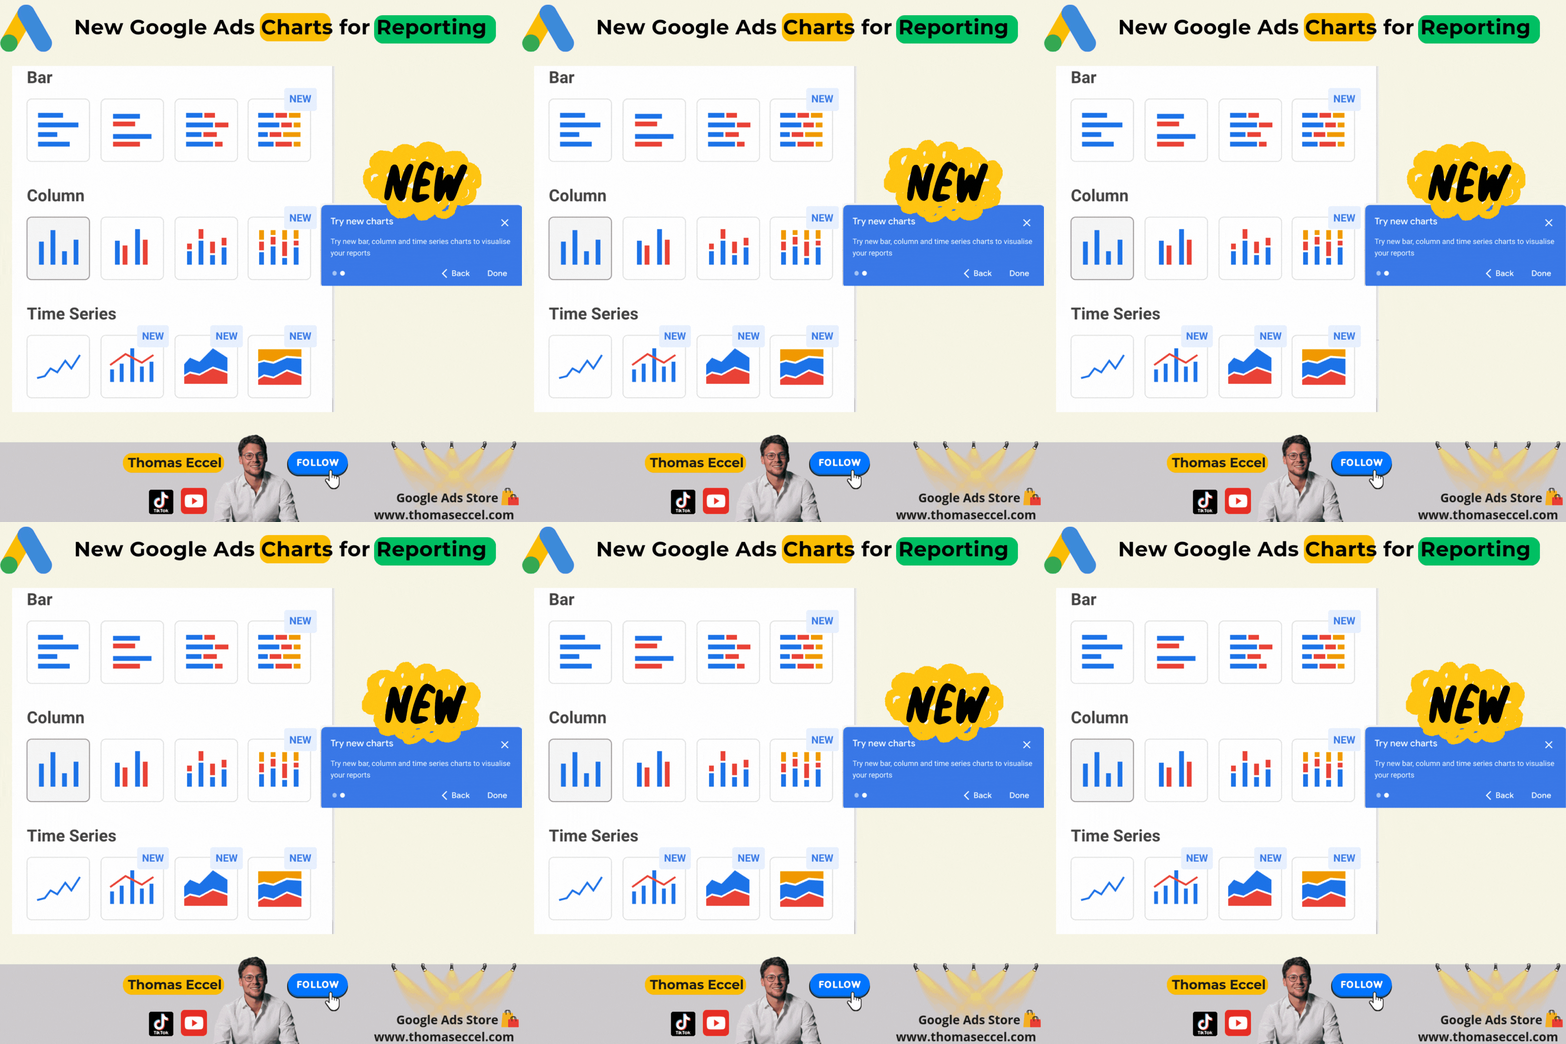
Google has added several new visualization options to reporting tools.
The newly introduced chart types include:
𝑩𝒂𝒓
↳ 𝟏𝟎𝟎% 𝐒𝐭𝐚𝐜𝐤𝐞𝐝 𝐁𝐚𝐫 𝐂𝐡𝐚𝐫𝐭: Supports one dimension with multiple metrics, or two dimensions with one metric.
𝑪𝒐𝒍𝒖𝒎𝒏
↳ 𝟏𝟎𝟎% 𝐒𝐭𝐚𝐜𝐤𝐞𝐝 𝐂𝐨𝐥𝐮𝐦𝐧 𝐂𝐡𝐚𝐫𝐭: Supports one dimension with multiple metrics, or two dimensions with one metric.
↳ 𝐂𝐨𝐦𝐛𝐨 𝐂𝐡𝐚𝐫𝐭: Supports up to 5 column metrics and 5 line metrics, using time as the x-axis.
𝑻𝒊𝒎𝒆-𝑺𝒆𝒓𝒊𝒆𝒔
↳ 𝐒𝐭𝐚𝐜𝐤𝐞𝐝 𝐀𝐫𝐞𝐚 𝐂𝐡𝐚𝐫𝐭: Supports one series dimension with one metric, or no series dimension with multiple metrics. Time is used on the x-axis.
↳ 𝟏𝟎𝟎% 𝐒𝐭𝐚𝐜𝐤𝐞𝐝 𝐀𝐫𝐞𝐚 𝐂𝐡𝐚𝐫𝐭: Supports one series dimension with one metric, or no series dimension with multiple metrics. Time is used on the x-axis.
These new visualizations allow more flexibility in presenting metrics across dimensions and time, improving the ability to highlight trends, comparisons, and distributions within reports.

